How to Find Estimates for Solutions on a Graph
Related Pages
Solving Quadratic Equations
Graphs Of Quadratic Functions
More Algebra Lessons
Solutions And The Quadratic Graph
We can solve a quadratic equation by factoring, completing the square, using the quadratic formula or using the graphical method.
Compared to the other methods, the graphical method only gives an estimate to the solution(s).
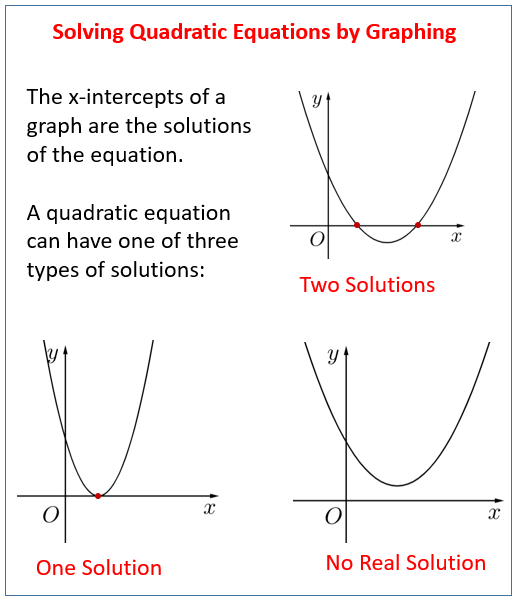
If the graph of the quadratic function crosses the x-axis at two points then we have two solutions. If the graph touches the x-axis at one point then we have one solution. If the graph does not intersect with the x-axis then the equation has no real solution.
The following diagrams show the three types of solutions that a quadratic equation can have: two solutions, one solution and no real solution. Scroll down the page for more examples and solutions.

We also have a quadratic equations calculator that can solve quadratic equations algebraically and graphically.
How to solve quadratic equations graphically using x-intercepts
The following video explains how the quadratic graph can show the number of solutions for the quadratic equation and the values of the solutions.
Examples of how to use the graph of a quadratic function to solve a quadratic equation: Two solutions, one solution and no solution.
- Use the graph of y = x2 + x - 6 to solve x2 + x - 6 = 0
- Use the graph of y = -x2 + 4 to solve -x2 + 4 = 0
- Use the graph of y = x2 -2x + 1 to solve x2 -2x + 1
- Use the graph of y = x2 + 1 to solve x2 + 1
- Show Video Lesson
Quadratic Equation With Two Solutions
We will now graph a quadratic equation that has two solutions. The solutions are given by the two points where the graph intersects the x-axis.
Example:
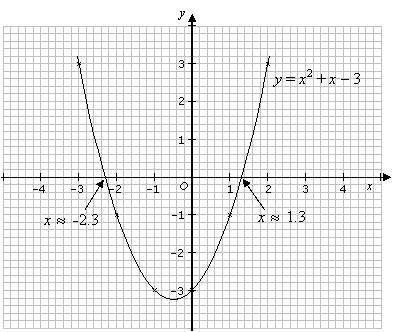
Solve the equation x2 + x – 3 = 0 by drawing its graph for –3 ≤ x ≤ 2.
Solution:
Rewrite the quadratic equation x2 + x – 3 = 0 as the quadratic function y = x2 + x – 3
Draw the graph for y = x2 + x – 3 for –3 ≤ x ≤ 2.
| x | –3 | –2 | –1 | 0 | 1 | 2 |
| y | 3 | –1 | –3 | –3 | –1 | 3 |

The solution for the equation x2 + x – 3 can be obtained by looking at the points where the graph y = x2 + x – 3 cuts the x-axis (i.e. y = 0).
The graph y = x2 + x – 3, cuts the x-axis at x ![]() 1.3 and x
1.3 and x ![]() –2.3
–2.3
So, the solution for the equation x + x –3 is x ![]() 1.3 or x
1.3 or x ![]() –2.3.
–2.3.
Recall that in the quadratic formula, the discriminant b2 – 4ac is positive when there are two distinct real solutions (or roots).
How to solve quadratic equation by graphing?
It uses the vertex formula to get the vertex which also gives an idea of what values to choose to plot the points. This is an example where the coefficient of x2 is positive.
Example:
Solve the following quadratic equation by graphing
x2 - 4x + 3 = 0
- Show Video Lesson
Find the roots of a quadratic equation by graphing
This video shows an example of solving quadratic equation by graphing. It uses the vertex formula to get the vertex which also gives an idea of what values to choose to plot the points. This is an example where the coefficient of x2 is negative.
Example:
Solve the following quadratic equation by graphing
-2x2 + 4x + 4 = 0
- Show Video Lesson
Quadratic Equation With One Solution {1root}
Example:
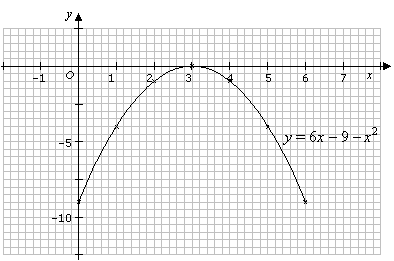
By plotting the graph, solve the equation 6x – 9 – x2 = 0.
Solution:
| x | 0 | 1 | 2 | 3 | 4 | 5 | 6 |
| y | –9 | –4 | –1 | 0 | –1 | –4 | –9 |

Notice that the graph does not cross the x-axis, but touches the x-axis at x = 3. This means that the equation 6x – 9 – x2 = 0 has one solution (or equal roots) of x = 3.
Recall that in the quadratic formula, in such a case where the roots are equal, the discriminant b2 – 4ac = 0.
Quadratic Equation With No Real Solution
Example:
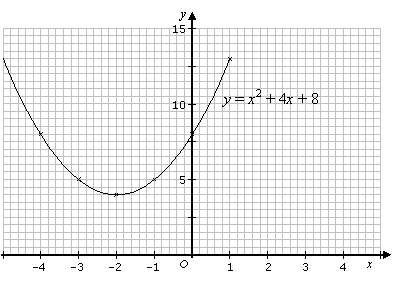
Solve the equation x2 + 4x + 8 = 0 using the graphical method.
Solution:
| x | –4 | –3 | –2 | –1 | 0 | 1 |
| y | 8 | 5 | 4 | 5 | 8 | 13 |

Notice that the graph does not cross or touch the x-axis. This means that the equation x2 + 4x + 8 = 0 does not have any real solution (or roots).
Recall that in the quadratic formula, the discriminant b2 – 4ac, is negative when there are no real solution (or roots).
Solving Quadratic Equations by Graphing Part 1
This video demonstrates how to solve quadratic equations by graphing.
- Solve one side of the equation for zero.
- Change the zero to y or f(x).
- Graph the function.
- Read the solutions where the function crosses or touches the x-axis.
Roots, x-intercepts, and zeros are given as synonyms for solutions. Finding roots from a table of values is also demonstrated.
- Show Video Lesson
Solving Quadratic Equations by Graphing Part 2
This video shows how to solve quadratic equations using the TI84 and TI83 series of graphing calculators.
Five problems are worked out. The different steps are shown including converting quadratic equations into calculator ready graphable quadratic functions.
The video shows how to examine in graph and table view what the solutions are. The case of having no solutions is shown as well as that of having only one solution.
- Show Video Lesson
Quadratic Equation Calculator
This Quadratic Equation calculator will solve the given quadratic equation algebraically and graphically. Use it to check your answers.
Try the free Mathway calculator and problem solver below to practice various math topics. Try the given examples, or type in your own problem and check your answer with the step-by-step explanations.

We welcome your feedback, comments and questions about this site or page. Please submit your feedback or enquiries via our Feedback page.
How to Find Estimates for Solutions on a Graph
Source: https://www.onlinemathlearning.com/quadratic-graph.html